Autobooks provides visual representations of your report data within the Autobooks Hub. This data can be sorted and filtered as needed to provide you with easy-to-understand graphics.
We've expanded the Reports menu item to include both the graphic view and your downloadable reports:
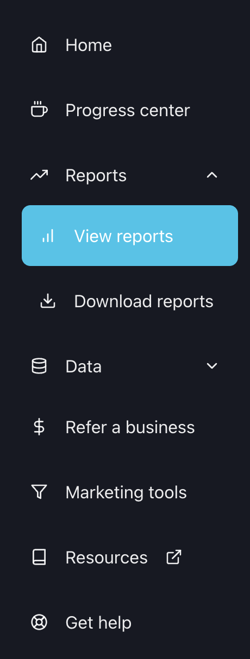
There are three categories of data to view within the View reports option. Each category is viewed by the tabs that appear at the bottom of the screen:
- Enrollments (data refreshed daily)
- Payment Activity (data refreshed daily)
- Profit Share (data refresh is variable, see section below)
Before you get started
All of the data we present is sortable and available for export. Here are some quick tips:
Filtering: Each page comes with a set of filters in the upper right corner of the screen to tailor the view of data to exactly what you're looking for. You can hold down the CTRL key to select multiple items in any of the filter dropdowns.
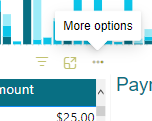
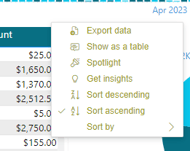
Exporting: Each segment of data is exportable to a .CSV file format. Just hover your mouse over the upper right corner of any area, and click the three dots to expose a dropdown that contains the export option.
Sorting: Each graph data legend is dynamic to sort the view of the graph. For example: click the Invoice color legend on the Payment Activity page, and the graph will change to display only Invoice data.
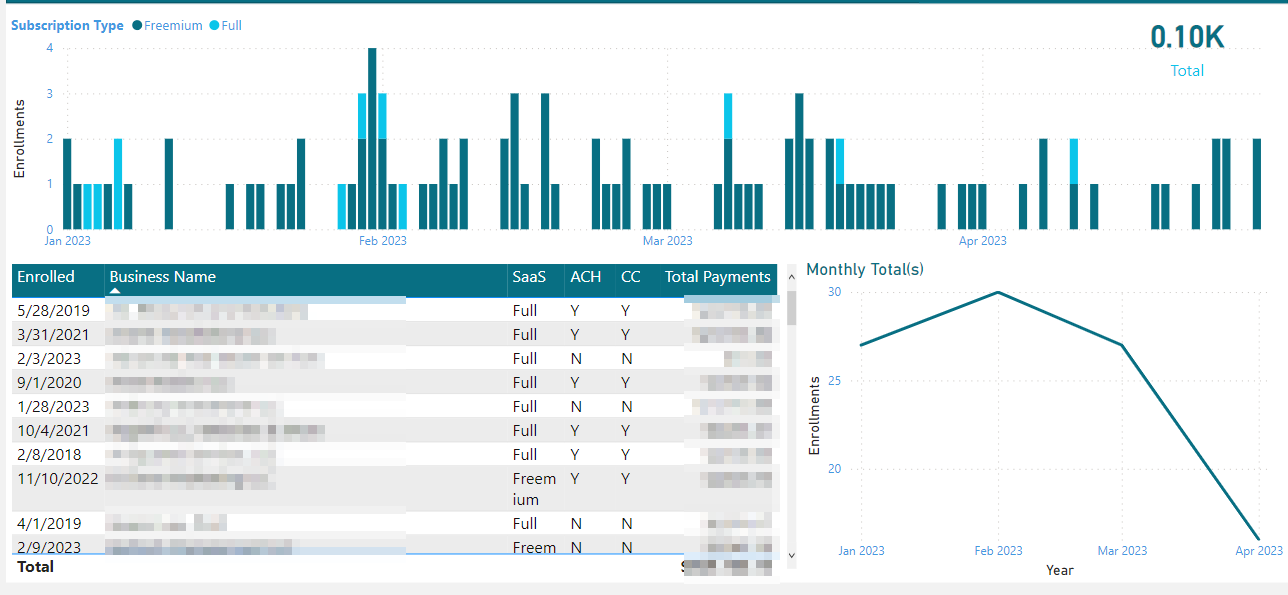
Enrollments
Enrollments view breaks down your financial institution's enrollment data in easy-to-understand graphics including:
- A weekly enrollment bar graph.
- List of enrolled businesses including: enroll date, business name, subscription level, and whether the business is approved to process ACH and/or card payments.
- Total number of historical enrollments.
- Percent of enrolled businesses that have accepted a digital payment using Autobooks technology.
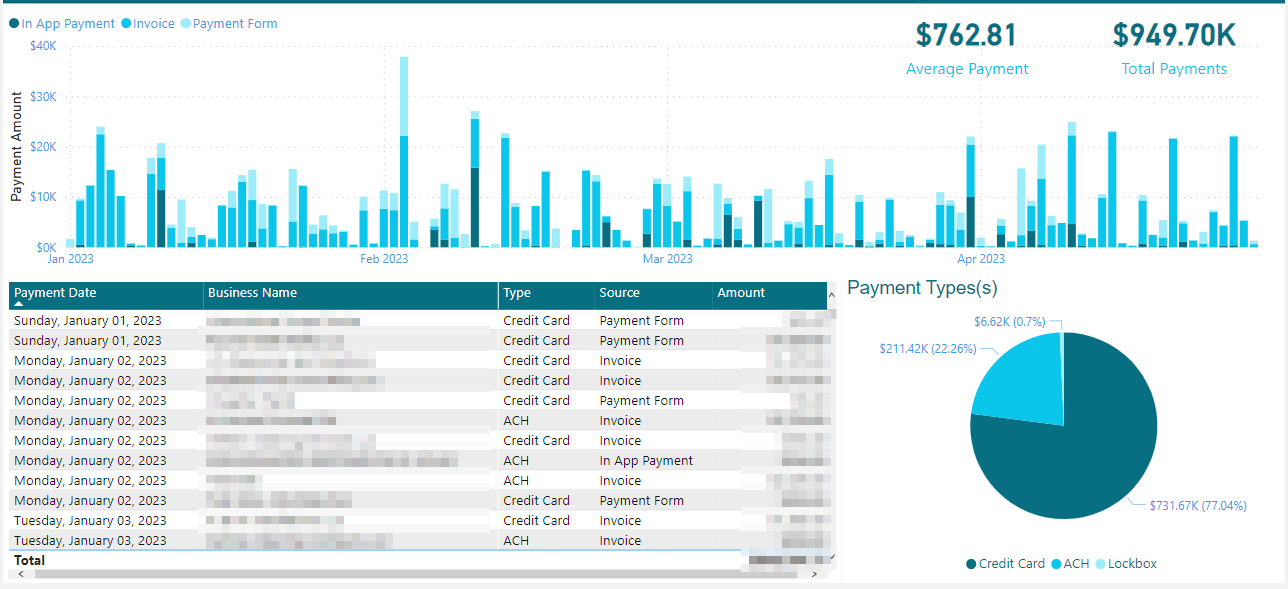
Payment Activity
The Payment Activity view breaks down individual payments processed by your enrolled business customers. Data includes:
- A bar graph showing weekly amount of payments made, including color indicators for in-app, invoice, and payment link payments.
- Payment detail by SMB list, which displays business name, payment date, payment type (credit or ACH), payment source, and payment dollar amount.
- A graph that breaks down payment type distribution across all payments made by your business customers.
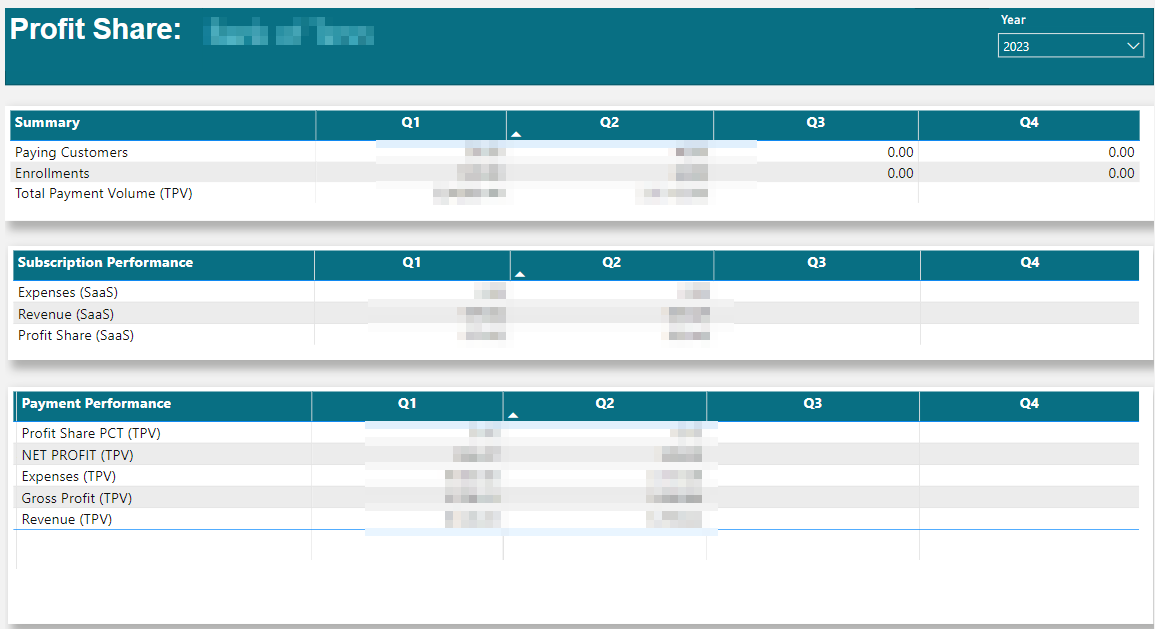
Profit Share
The Profit Share view breaks down your Total Payment Volume (TPV) statistics. Revenue statistics will refresh daily, while Expense data will be refreshed after a monthly calculation. Data includes:
- Summary Data:
- of paying customers (SaaS)
- of enrollments
- of total payment volume (TPV)
- Subscription Performance:
- Expenses
- Revenue
- Profit share
- Payment Performance:
- Profit Share PCT - your FI's percentage of total TPV you are contractually eligible to earn
- Net Profit
- Expenses
- Gross Profit
- Revenue